Catherine Hsu
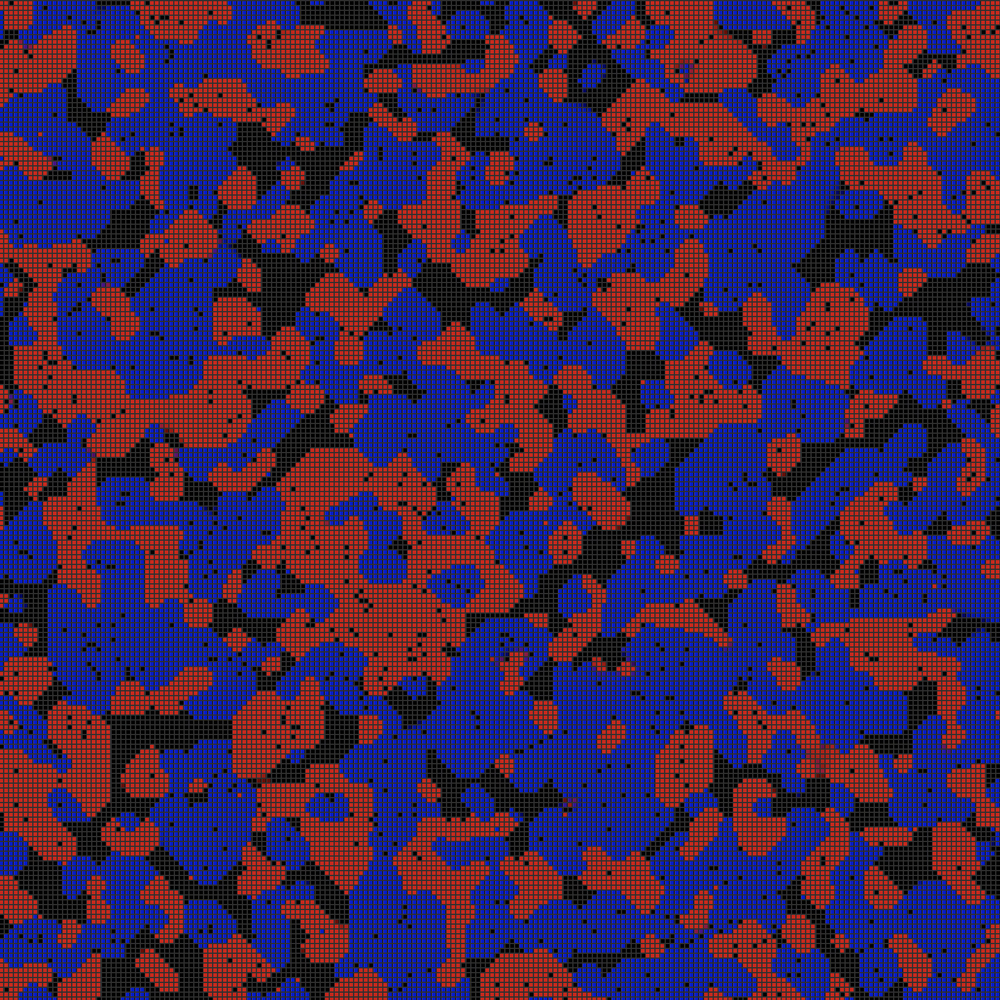
My Game of Life demo depicts a visual representation of the mobility of political beliefs between people in close proximity physically (geographical sorting) and psychologically (confirmation bias) and how this leads to echo chambers.
1. BALANCING “OUTLIERS” AND “CONFORMERS”
The grid that I created is 1600 by 912, and it represents an estimate of the U.S. population who are citizens. Currently, the population of the United States is approximately 314.1 million, of which 93% are citizens, according to Ballotpedia. This means there are about 292,113,000 American citizens, of which about 50% are of eligible voting age and actually do vote (~146,057,000). With cell size being 4, each box represents 10 people.
A larger grid size with smaller cells would likely extend the game duration because the code would have to run through the adjacent rules more times in order to reach a standstill.
2. ADJACENCY RULES
Each cell begins by being assigned a color:
-
black, symbolizing someone apolitical or Independent
-
red, symbolizing someone right-leaning
-
blue, symbolizing someone left-leaning
The colors are assigned randomly according to the probability of America’s current political demographic. A random number is generated for each cell from 100 and is assigned a color as follows:
-
0 to 28 (28%) — blue (Democrat)
-
29 to 52 (24%) — red (Republican)
-
53+ (46%) — black (Independent or apolitical)
These numbers are taken from a recent Gallup Poll conducted January 3-16 of 2022. The poll revealed that 24% of the population consider themselves Republicans, 28% consider themselves Democrats, and 46% consider themselves Independent. Sidenote: there are very few true Independents in reality, but in this GOL demo, the probability of being assigned a black color remains 46%, per the poll.
Once the game begins, the adjacency rules are as follows:
-
If a blue/red cell…
-
…has less than 2 political neighbors, the cell becomes apolitical, because there are no salient political issues near them, they are not receiving enough information and become less involved, etc.
-
…has more neighbors with the opposing political leaning than with their same political leaning, the cell is replaced by the opposite color, either representing someone being convinced to change their party affiliation (realistically rare) or moving away from the area and being replaced by a cell of the opposite color (representing geographical sorting).
-
…has an equal amount of neighbors of each political leaning, the cell remains the same color, due to selective information absorption, confirmation bias, etc.
-
-
If a black cell…
-
…has less than 3 political neighbors, the cell remains apolitical because there are no salient issues around them and they are not receiving information. This threshold is higher than the threshold for an existing colored cell because the learning curve for initially getting into politics is higher.
-
…has an equal amount of neighbors of each political leaning, the cell remains black-colored, representing someone who remains neutral (a true Independent who flips back and forth), or someone who does not retain enough information from either side to establish an opinion.
-
…is surrounded by all cells of the same color (either blue or red), the cell turns into the same color as its neighbors, representing someone absorbing the same political beliefs of the people around them.
-
3. DATA AS A DESIGN MATERIAL
In the second iteration of my Game of Life demo, I added opacity as an additional factor to depict how political leanings cannot be expressed in only binaries. As I mentioned before, most people who consider themselves Independent are not truly neutral, but lean Democratic or Republican; these half-opacity cells represent these people who have weaker political leanings.
Compared to the original video, the second video depicts the slower transfer of political information — people’s beliefs do not flip-flop immediately but rather slowly spread into each other.