For this section, I messed around with the cellSize, probabilityOfAliveAtStart, and the various rules surrounding the number of neighbours surrounding a cell.
I found that modifying these 3 statements along with the cell size produced some very
interesting results.
-
When you modify the cellSize you change the probability of a pattern occurring. A lower cell size has a higher probability of producing a pattern while a lower cellSize has a lower probability.
-
If you modify the probabilityOfAliveAtStart (PAS) you change the probability of a pattern occurring. In this case PAS is too high, the screen has a higher chance of filling up completely while a lower PAS might cause all the cells to die. Finding that middle ground in relation to cellSize and those 3 statements will produce interesting patterns. (cellSize and PAS are directly correlated to probability of producing a pattern)
-
Without changing anything, the screen will fill and end up being static.
-
If you increase just the first statement up to a point, many cells will die out and then replenish filling the screen slower. After that point all the cells will die.
-
If you decrease just the second statement up to a point, you will see a static maze looking pattern. As you continue to decrease this value, the grid becomes less cluttered allowing a chance for patterns to emerge.
-
If you were to increase the first statement and decrease the second, It causes many different patterns to appear. You can also change the third statement or add conditions to it to cause new patterns.
-
If the first statement is < 3, the second statement is > 4, and the third statement == 3 and ==4, you get a really cool infinite water effect
-
If the first statement is < 2 the second statement is > 3, and the third statement == 3, you get to see a bunch of different repeating patterns
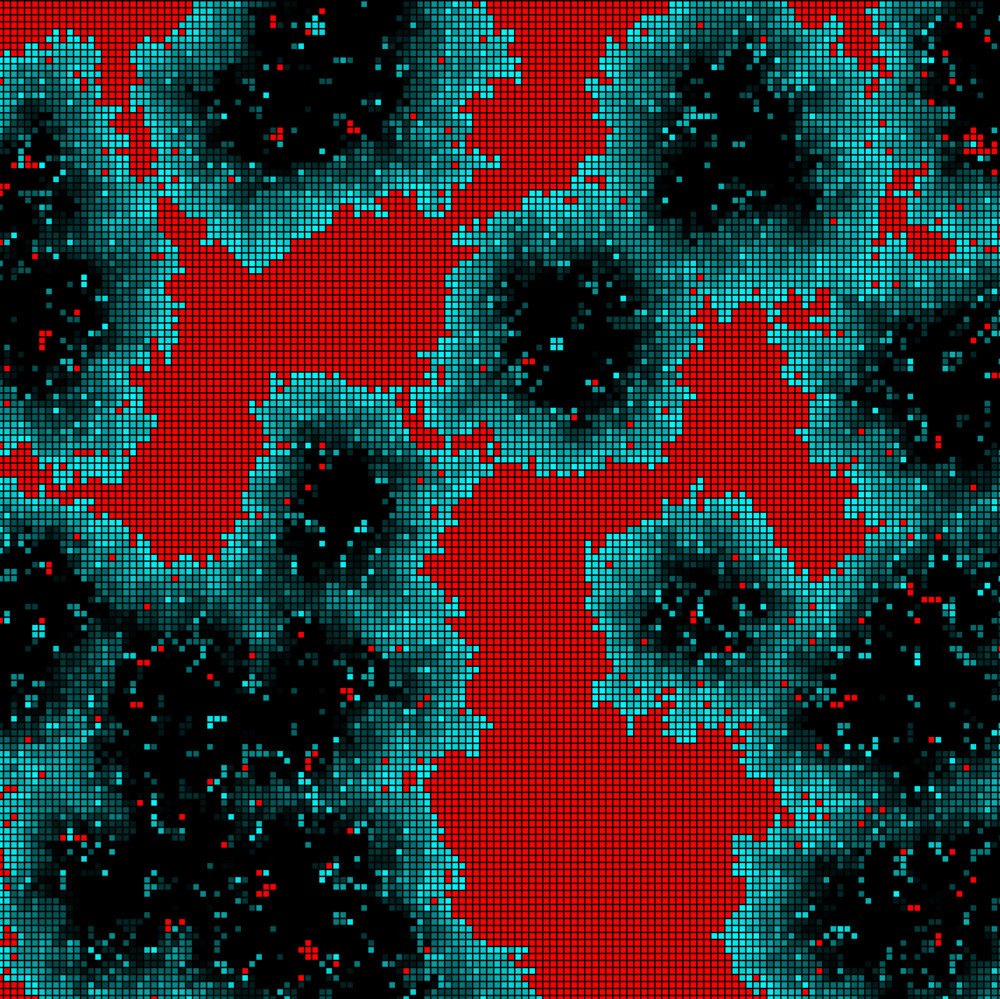
Apocalypse Rules
I wanted to create a simulation of how a virus could affect a community and describe the effect of outbreak and repopulation. Rather than using the same code from the example I chose to write my own with a class implementation due to the number of variables surrounding each cell.
1. Lower probability of being infected if vaccinated than if not
2. If infected for x days, cell dies
3. If infected, x chance that neighbors get infected
4. If infected and move, x chance that neighbor switched with gets infected
5. If infected, x chance to be cured
6. If not infected and neighbor is dead, x chance to repopulate
I also messed around with the CellSize, Probability, and the rules surrounding the neighbors.
-
By increasing the cellSize you have a lower probability of manipulating the image and vise versa due to a lower/higher probability of the rules applying
-
By adding blur, it fills the dead cells quicker and causes the image to look less pixelated while creating patches of blurriness
-
By adding an ERODE filter, it causes the dead pixels to warp and contract. By adding the DILATE filter, it causes the dead pixels to warp and expand eventually turning into simple geometry. The DILATE filter creates some cool patterns like plusses, boxes, and more. This filter completely distorts the image after some time. It seemed to me like the ThRESHOLD filter caused large sections of the image to shift
-
When manipulating the rules surrounding neighbors I found that different patterns would emerge in how it distorted the image. In some cases it would cause dead pixels to stay longer or it would cause the dead pixels to fill up quicker. It would also cause more or less distortion on the image.